
machine monitoring
The dashboard provides real-time visibility into all your machines' health, performance, and process status.
machine status
online/offline detection
The agent sends a heartbeat to Firestore at an adaptive interval - every 5 seconds when the desktop app's window is open on the machine, 30 seconds when processes are running, or 120 seconds when idle.
The machine card status pill is binary:
| status | condition | indicator |
|---|---|---|
| online | Agent reports the machine as online | Green pill |
| offline | Agent reports offline, or the dashboard's local timeout fallback marks an old heartbeat offline | Red pill |
The adjacent heartbeat timestamp uses a separate stale-display rule. Heartbeats newer than 5 minutes render as a clock time in the selected dashboard timezone. Heartbeats older than 5 minutes render as a relative age, such as 14m ago, in red.
last seen
Each machine shows a last-heartbeat timestamp. For offline or stale machines, this tells you when the machine last communicated. The timestamp tooltip always shows the full date, time, and timezone.
system metrics
Metrics are reported by the agent alongside each heartbeat (see adaptive interval above):
| metric area | values shown |
|---|---|
| CPU | Per-CPU usage percentage, model, and temperature when reported |
| memory | RAM usage percentage plus used/derived total GB |
| disk/storage | Per-volume storage percentage, used/total GB, and read/write disk I/O throughput |
| GPU | Per-GPU usage percentage, VRAM usage, and temperature when reported |
| network | Per-NIC transmit/receive throughput and utilization, plus gateway ping latency and packet-loss percentage when available |
| displays | Live monitor topology, monitor count, effective resolution after rotation, primary-display marker, mosaic data, display-drift indicator, and auto-restore circuit-breaker indicator. See displays |
| local time | Machine local clock and IANA timezone when multiple machine timezones are visible |
| screen access | Machine-menu entry points for screenshot capture/history and live view on online machines |
color coding
Usage metrics use the same threshold bands as the dashboard accent bars and hover rings:
| color | threshold | meaning |
|---|---|---|
| Emerald | 0-29% | Low usage |
| Violet | 30-49% | Medium-low usage |
| Sky | 50-69% | Medium usage |
| Amber | 70-84% | High usage |
| Red | 85-100% | Critical usage |
Temperature values use separate hardware thresholds: normal below 70 C, warning from 70 C to below 85 C, and critical at 85 C or higher. Temperatures can display in Celsius or Fahrenheit according to the user's preferences.
picking which device a row shows
A machine with more than one CPU, disk, GPU, or network interface gets a small dropdown on that metric row. The dropdown is hidden when there is only one device to choose from.
auto (most active) is the default: the row follows whichever device the agent reports as primary. Pick a specific device and the row pins to it.
The choice is yours alone and is remembered per machine in card view, and once for the whole table in list view. If a pinned device disappears from a machine — a disk unmounted, a NIC removed — the row falls back to the primary device rather than going blank.
view modes
card view
The default view displays each machine as a card:
- Machine name and status indicator
- Last-heartbeat timestamp and optional local machine clock/timezone
- CPU, memory, disk/storage, GPU, and network metrics
- Disk read/write throughput and network transmit/receive throughput
- Display topology summary with drift and auto-restore indicators
- Sparkline mini-charts showing recent trends
- Process list with status badges
- Agent version
- The machine menu (⋮) — every action it offers is listed under the machine menu below
Click a machine card to expand details.
list view
A compact table view with sortable columns:
- Machine name
- Status (online/offline)
- CPU, memory, disk/storage, GPU, and network values
- Display entry point with drift and auto-restore indicators
- Process count
- Last heartbeat
- Agent version
Useful when managing many machines.
sparkline charts
Each metric in card view shows a tiny sparkline chart representing recent values. These give you an at-a-glance trend without clicking into the machine.
historical metrics
Click on a machine to view detailed historical metrics:
time ranges
| range |
|---|
| hour |
| day |
| week |
| month |
| year |
| all |
charts
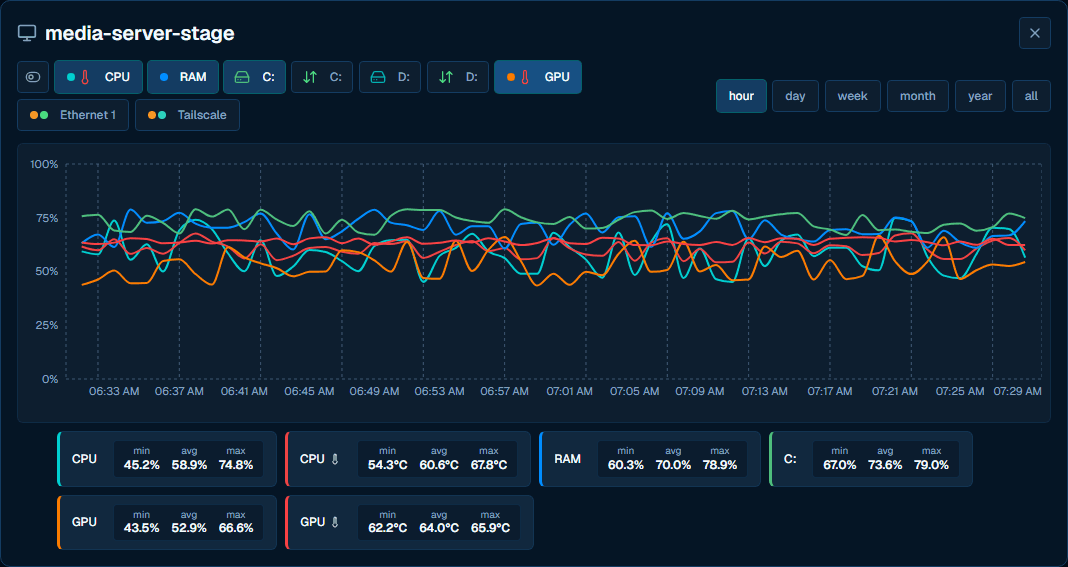
The metrics detail panel shows interactive Recharts line graphs for:
- CPU usage and temperature over time
- Memory usage over time
- Per-disk storage usage over time
- Per-volume disk I/O read/write activity
- GPU usage, VRAM usage, and temperature over time (if available)
- Per-NIC network transmit/receive utilization or throughput
- Display topology detail through the display panel
Hover over data points for exact values and timestamps.
process status
Each machine card shows its configured processes with status badges:
| badge | state | meaning |
|---|---|---|
| Green | RUNNING | Process is alive and responding |
| Yellow | LAUNCHING | Launch is in progress |
| Yellow | QUEUED | Launch is queued or waiting on a start delay |
| Yellow | RESTARTING | Operator-initiated restart is in flight |
| Yellow | STALLED | Process exists but not responding |
| Red | LAUNCH_FAILED | Launch was attempted and failed - the badge reads failed |
| Red | KILLED | Process was terminated |
| Red | STOPPED | Launch mode is not off but nothing is running - crashed, outside its schedule window, not yet launched, or the executable is missing |
| Grey | INACTIVE | Launch mode is off - owlette is not supervising this process |
When a machine is offline the dashboard cannot know the current state, so every process badge reads unknown instead of its last status.
Click a process to open the Process Dialog for management and configuration.
restart pending
When a managed process exhausts its relaunch attempts, the agent stops trying and asks for a restart instead of deciding on its own. It raises a restart pending flag on the machine, and the card shows an amber banner naming the process — restart pending: ndi_recording crashed 3 times.
The machine itself also opens a restart prompt on its own screen, as a local fallback for a machine nobody is watching from the dashboard. That prompt has a two-minute countdown and restarts the machine on its own if nobody touches it — so the banner is usually a record of a restart that is about to happen anyway, not a decision waiting on you. See relaunch limits.
Site admins get two actions on the banner:
| action | what it does |
|---|---|
| approve | Sends the restart command, exactly as restart machine would. Only offered while the machine is online — the command would be refused otherwise. |
| dismiss | Clears the flag and resets that process's relaunch counter, so it gets a fresh set of attempts. |
The banner outlives an unreachable machine. The flag is agent-written and only the agent's next service start clears it locally, so a machine that crashed and never came back keeps showing it. The banner renders greyed rather than amber in that case and adds machine offline, cannot restart — it is a record of something that happened, not a live alarm.
Dismiss still works on an offline machine. It clears cloud state through the API rather than asking the agent, which is exactly the case that most needs clearing.
Dismissing requires MACHINE_EXEC_COMMAND — the same bar as sending the restart itself.
reboot countdown & cancel
When a reboot or shutdown is scheduled (from the dashboard, from hoot, from a restart schedule, or via the Tier 3 reboot_machine / shutdown_machine tools), the machine card displays a red pulsing MM:SS countdown timer in place of its normal status indicator. This gives the operator a visible, unambiguous window in which to abort.
timing
- Reboot and shutdown commands use a 30-second delay so running processes can flush state.
- The Cancel button on the machine card is the full-dashboard equivalent of the
cancel_reboottool. The agent runsshutdown /aand clears the reboot or shutdown flags. - Hovering the countdown swaps the
MM:SStext to cancel; clicking it sends the cancel command. - Cancel is available while more than 5 seconds remain in the countdown. The final 5 seconds are locked because Windows
shutdown /ais unreliable once the shutdown is already committing. - If the current user is not a site admin, no cancel handler is available, or the countdown has entered the final 5 seconds, the card shows a text-only
rebooting...orshutting down...pill instead of a clickable countdown. - Once the countdown expires the machine card flips to a rebooting or shutting-down state and the cancel path closes.
This behavior was introduced in v2.6.2 (commit 52e1ed8) and replaces the older fire-and-forget reboot UX.
the machine menu
The ⋮ button on a card or row opens the machine menu. What it offers depends on whether the machine is online and whether you are a site admin:
| action | needs | what it does |
|---|---|---|
| restart machine | online, site admin | Reboots the machine after a 30-second delay. See reboot countdown & cancel |
| schedule restarts | site admin | Opens the restart schedule editor. On an online machine it is the small sliders icon beside restart machine; on an offline one it is a menu item of its own |
| shutdown machine | online, site admin | Powers the machine off, same 30-second delay |
| cancel restart / cancel shutdown | online, site admin, countdown running | Replaces the two entries above while a countdown is in flight |
| screenshot | online | Captures the machine's screen and opens the screenshot history |
| swoop | online, agent reports it can stream | Opens the live remote-desktop session — see swoop, which covers the site policy that decides whether the session itself is allowed |
| live view | online, agent cannot stream | The older screenshot slideshow. Exactly one of swoop and live view is ever offered, so the menu never loses its screen entry |
| view displays | any signed-in user | Opens the displays panel |
| mute alerts / unmute alerts | any signed-in user | Silences every alert email for this machine, for you only. Listed under account settings → alerts |
| revoke token | site admin | Invalidates the agent's refresh token for this hostname. See below |
| remove machine | site admin | Removes the machine from the site. See below |
An offline machine keeps schedule restarts, view displays, mute alerts, revoke token and remove machine — everything else needs an agent on the other end.
revoke token
Revoking invalidates the agent's stored refresh token, so that agent can no longer reconnect until it is paired again. Two scopes are offered: the most recently used token for the hostname, or every token for it.
This is the per-machine version of the token management page, which does the same thing across a whole site.
remove machine
Removal is permanent and deletes the machine's data, process configuration, and command history, and deregisters the agent.
- A machine with deployments in progress cannot be removed. The dialog blocks confirmation until they finish.
- An online machine can be removed. Its agent notices and stops syncing.
- Getting it back means re-running the installer and pairing it again with a fresh 3-word phrase.
machine information
Each machine reports additional details:
| field | description |
|---|---|
| Hostname | Windows computer name (used as machine ID) |
| OS | Windows version (e.g., "Windows 11 Pro 10.0.22631") |
| CPU model | Processor name (e.g., "Intel Core i9-9900X") |
| Agent version | Installed owlette version (e.g., "2.1.8") |
| Uptime | Time since last agent start |
dashboard getting started
This guide walks you through your first experience with the owlette dashboard - from login to seeing your first machine.
restart schedules
Restart a machine on a recurring weekly schedule — a set of days and a time, in the machine's own timezone. Set it per machine from the machine menu, save it as a site preset, and copy it to the rest of the fleet.